Top 10 SIEM use cases to implement
Logpoint is a Security Information and Event Management (SIEM) solution that collects, stores, and analyzes log data from the entire IT infrastructure to detect suspicious activities and respond to threats. Although SIEM tools are primarily used for security purposes, there are several other use cases that every organization should be aware of, such as automated compliance management, operational performance monitoring, or log management.

01Detecting compromised user credentials
Ensure to have a use case and workflow in place to detect any attempts to compromise user credentials through Brute Force, Pass the Hash, Golden Ticket, or other methods. In case of a successful compromise, it is crucial to identify the users and entities affected to investigate the impact and prevent further damage.
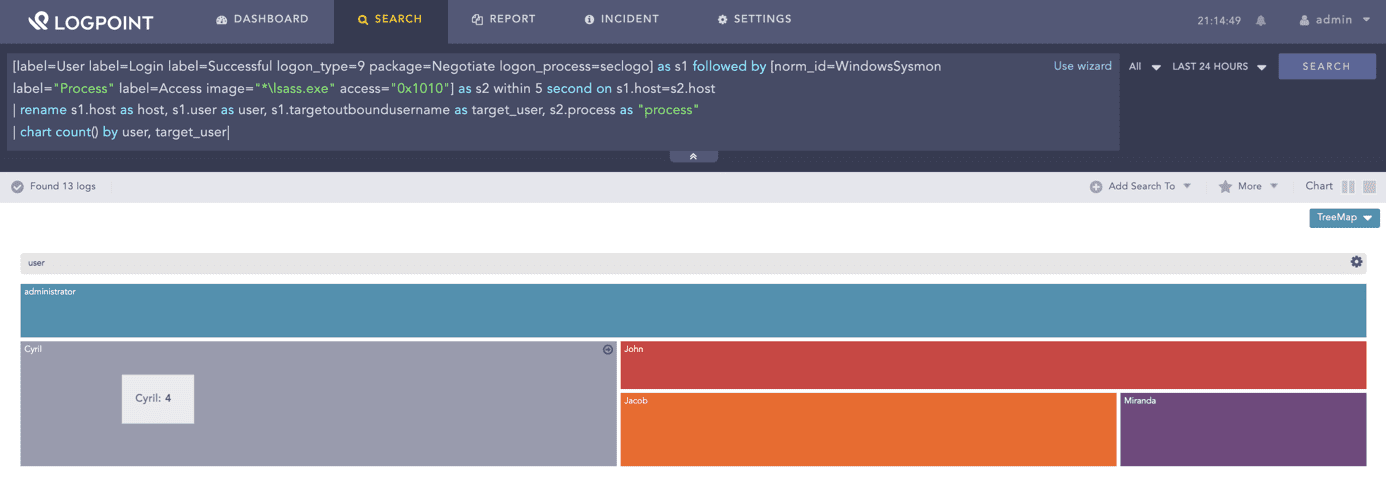
[label=User label=Login label=Successful logon_type=9 package=Negotiate logon_process=seclogo] as s1 followed by [norm_id=WindowsSysmon label="Process" label=Access image="*lsass.exe" access="0x1010"] as s2 within 5 second on s1.host=s2.host
| rename s1.host as host, s1.user as user, s1.targetoutboundusername as target_user, s2.process as "process"
| chart count() by user, target_user
02Tracking system changes
Set appropriate rules for flagging critical events, such as unauthorized changes to configurations or deletion of audit trails. These changes should be escalated immediately to stop the damage and minimize further risks, as tampering with audit logs is always a red flag.
label=Log label=Clear
| chart count() by log_ts, host, user, target_channel
03 Detecting unusual behavior on privileged accounts
Privileged users, such as system or database administrators, have extended access rights, making them an attractive target for hackers. With a SIEM, analysts can keep a close eye on any actions these privileged users perform and look for unusual behavior that might indicate a threat or a compromise.
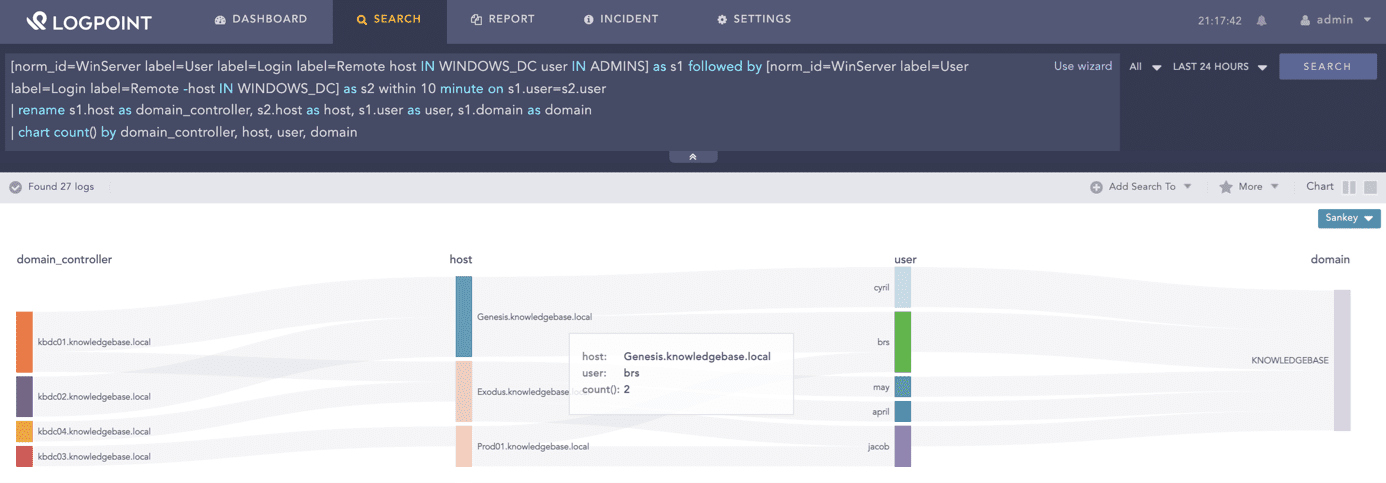
RDP login to a domain controller followed by RDP login to another workstation
[norm_id=WinServer label=User label=Login label=Remote host IN WINDOWS_DC user IN ADMINS] as s1 followed by [norm_id=WinServer label=User label=Login label=Remote -host IN WINDOWS_DC] as s2 within 10 minute on s1.user=s2.user
| rename s1.host as domain_controller, s2.host as host, s1.user as user, s1.domain as domain
| chart count() by domain_controller, host, user, domain04Secure cloud-based applications
Cloud computing has many advantages, but it also comes with several challenges: meeting new compliance requirements, improving user monitoring and access control, or preparing against possible malware infections and data breaches. A SIEM should support cloud-based applications as log sources, such as Salesforce, Office365, or AWS, to extend compliance monitoring and threat detection to the cloud.
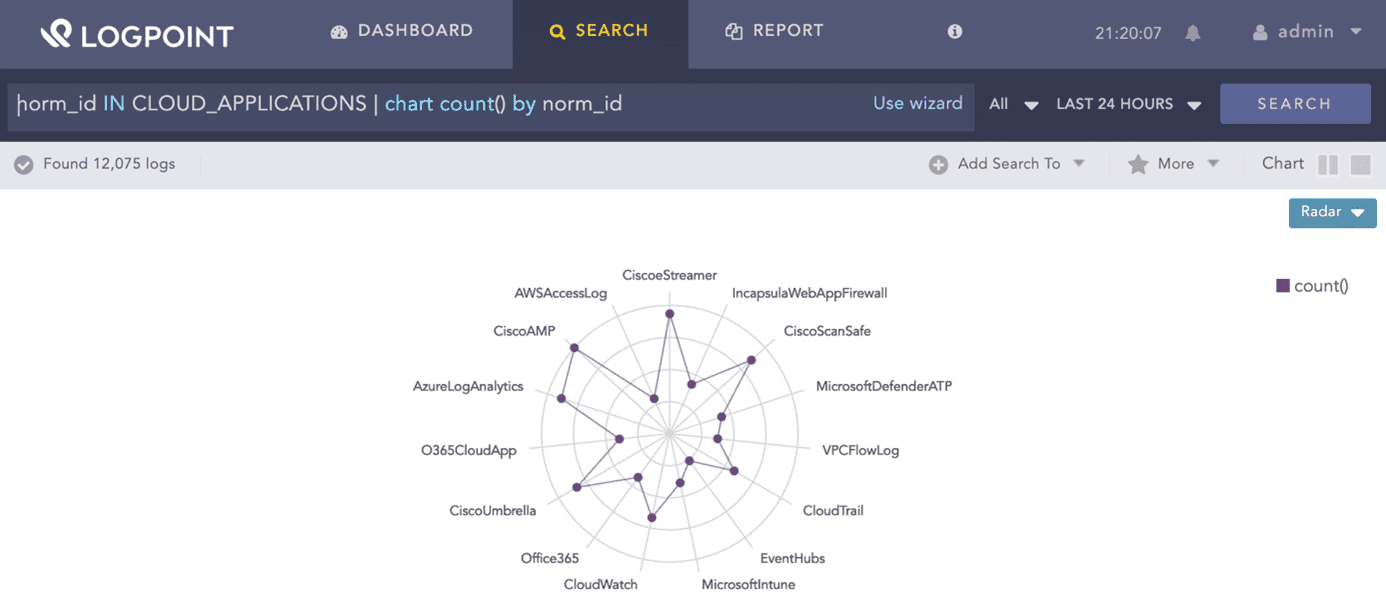
norm_id IN CLOUD_APPLICATIONS | chart count() by norm_id05Phishing detection
Phishing is an attempt to obtain sensitive information used in fraud and impersonation. This includes attempts to acquire personal information, such as social security numbers, bank account numbers, or PIN codes and passwords. It is crucial to ensure that these data types are protected across the entire organization. Phishing, especially spear phishing, is often used to gain initial access within a network. When receiving a phishing email, analysts can use SIEM to track who received them, clicked on any links in them, or replied to them, enabling them to take immediate action to minimize damage.
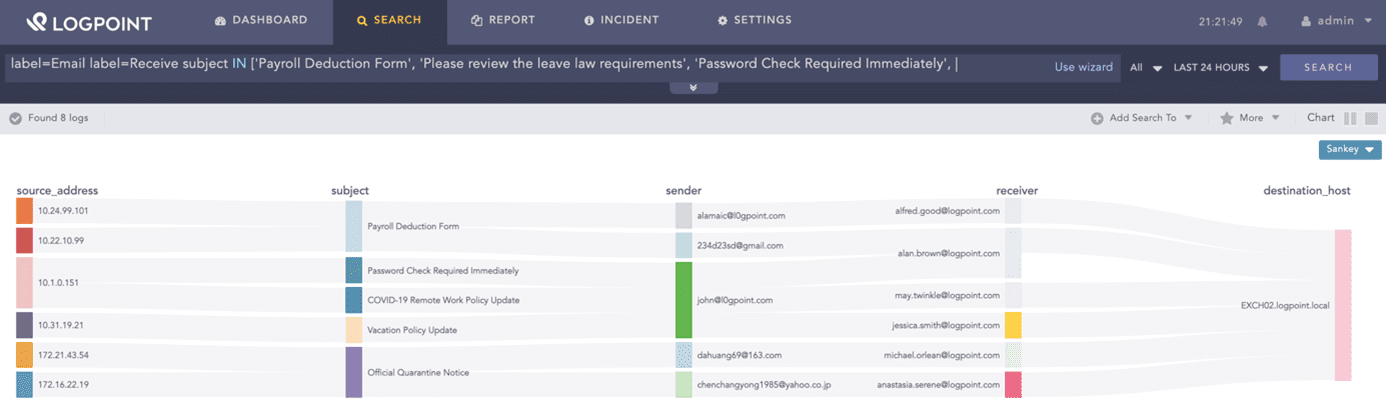
Searching for most-clicked general email subject lines:
label=Email label=Receive subject IN ['Payroll Deduction Form', 'Please review the leave law requirements', 'Password Check Required Immediately', 'Required to read or complete: "COVID-19 Safety Policy"', 'COVID-19 Remote Work Policy Update', 'Vacation Policy Update', 'Scheduled Server Maintenance -- No Internet Access', 'Your team shared "COVID 19 Amendment and Emergency leave pay policy" with you via OneDrive', 'Official Quarantine Notice', 'COVID-19: Return To Work Guidelines and Requirements']
| chart count() by source_address, subject, sender, receiver, destination_host06Monitoring loads and uptimes
With a SIEM system tuned with appropriate correlation rules and alerts, it becomes possible to continuously monitor load, uptime, and response time on various servers and services. This enables catching faults and overloads early, ensuring that downtimes and the cost associated with them are prevented.
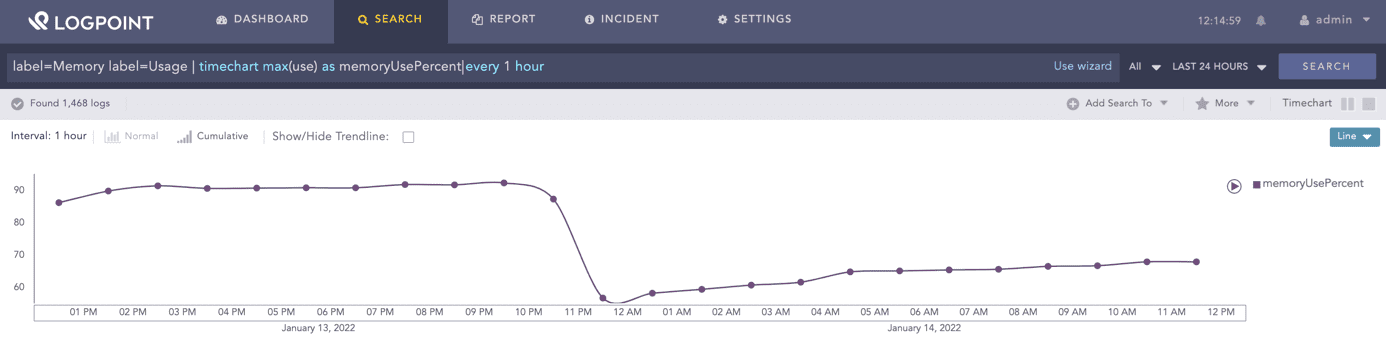
label=Memory label=Usage | timechart max(use) as memoryUsePercent every 1 hour07Log Management
Databases, applications, users, and servers generate high amounts of log data. A SIEM tool can normalize and centralize the collection of log data. This enables smooth analysis and security correlation and allows the IT security team to search through the data for finding specific keywords or values.
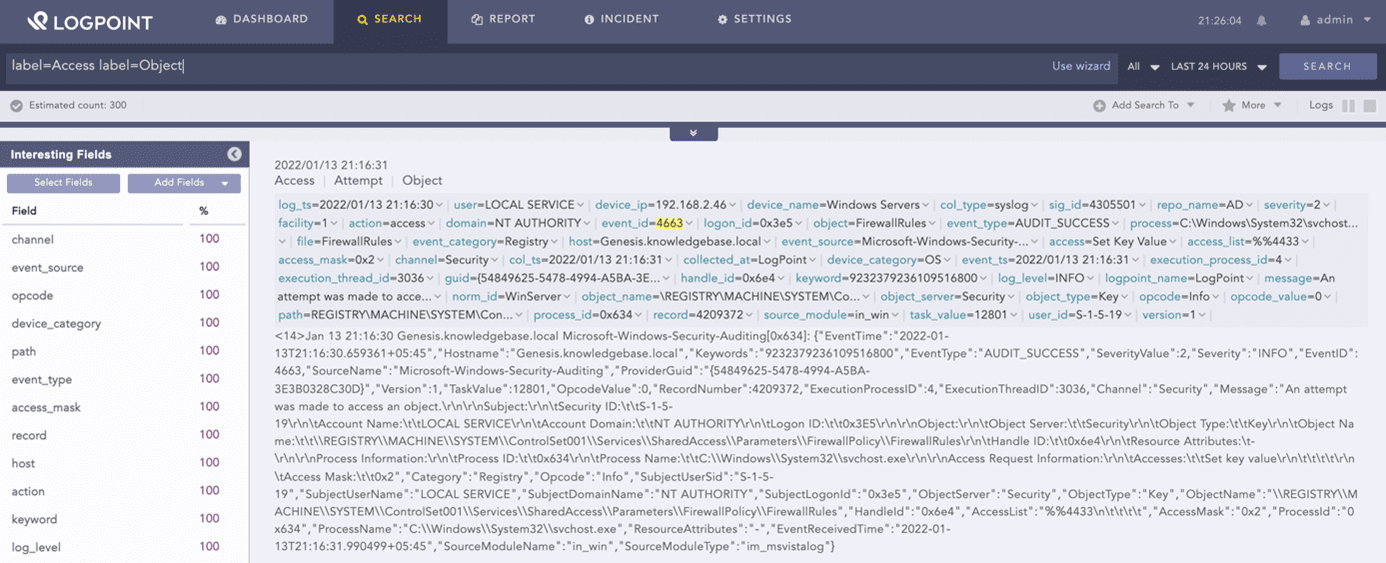
label=Access label=Object08SIEM for GDPR, HIPAA, or PCI compliance
Organizations are subjected to a high number of compliance regulations, such as GDPR, HIPAA, or PCI. With a SIEM system, you will be able to document when and by whom data was accessed, read, or copied, fulfilling compliance requirements, and preventing violations.
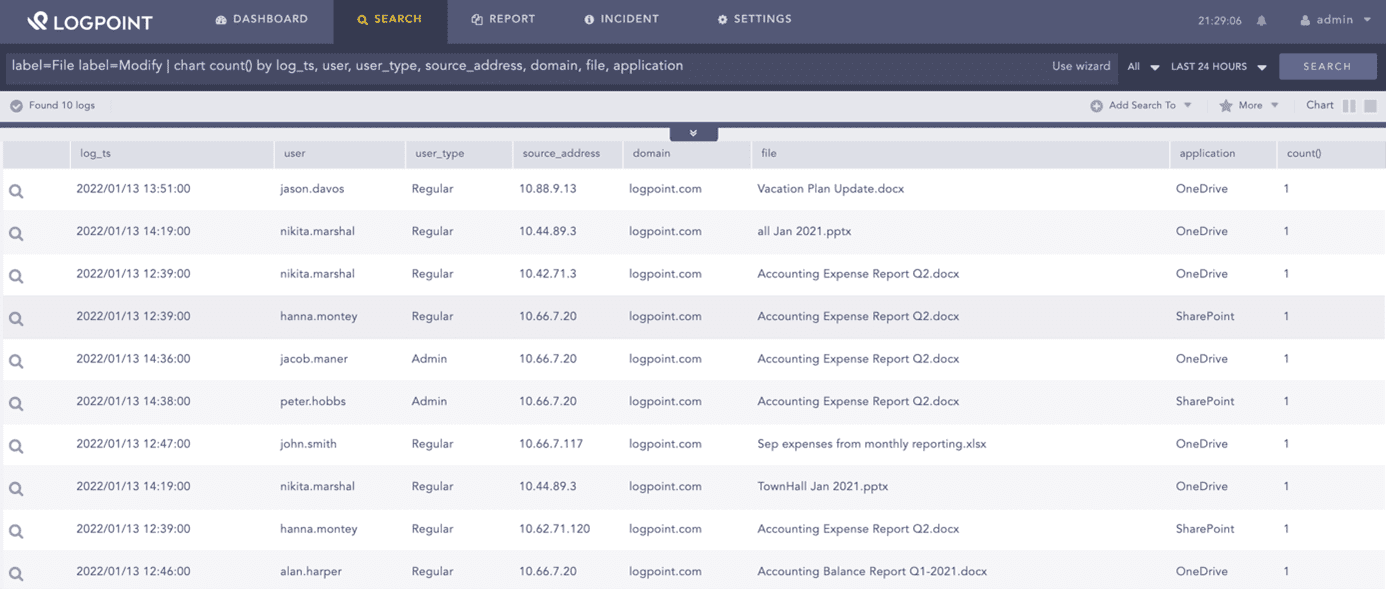
label=File label=Modify | chart count() by log_ts, user, user_type, source_address, domain, file, application09Threat Hunting
The process of actively searching for cyber risks in an organization or network is known as threat hunting. A threat hunt can be carried out in response to a security issue or to uncover new and unknown attacks or breaches. Threat hunting requires access to security data from all places across the company, which a SIEM can provide.
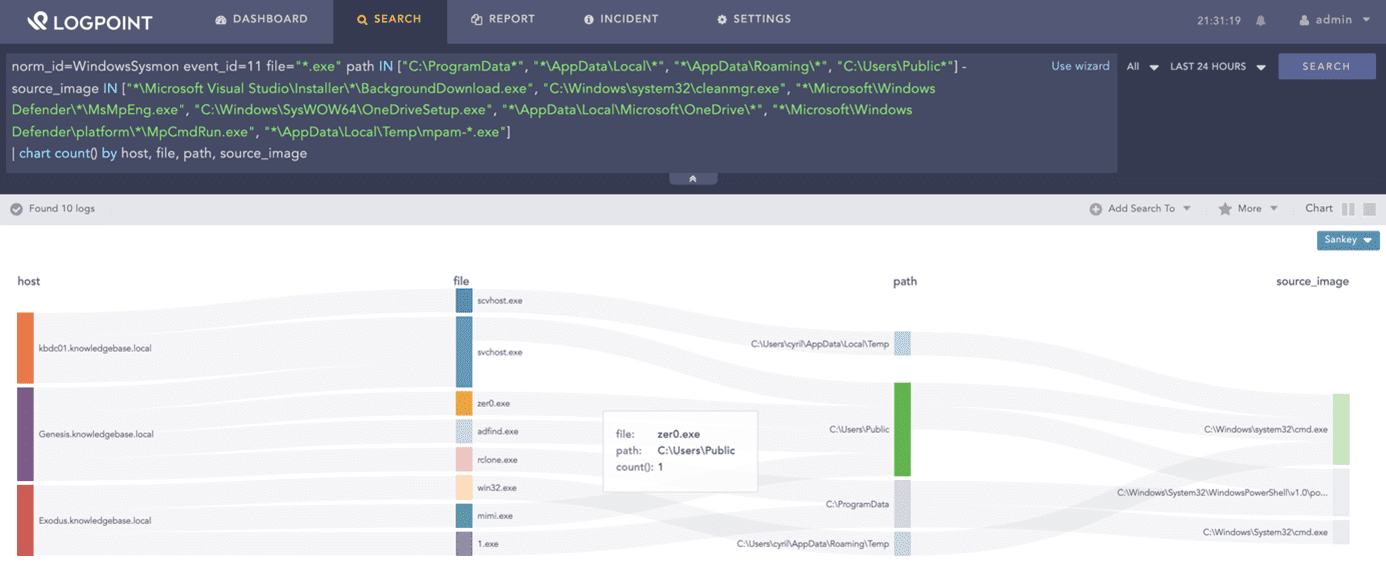
Hunting for dropping of EXE in suspicious locations:
norm_id=WindowsSysmon event_id=11 file="*.exe" path IN ["C:ProgramData*", "*AppDataLocal*", "*AppDataRoaming*", "C:UsersPublic*"] -source_image IN ["*Microsoft Visual StudioInstaller*BackgroundDownload.exe", "C:Windowssystem32cleanmgr.exe", "*MicrosoftWindows Defender*MsMpEng.exe", "C:WindowsSysWOW64OneDriveSetup.exe", "*AppDataLocalMicrosoftOneDrive*", "*MicrosoftWindows Defenderplatform*MpCmdRun.exe", "*AppDataLocalTempmpam-*.exe"]
| chart count() by host, file, path, source_image10SIEM for automation
SIEM automates threat detection activities and provides the foundation for automated incident response. Forwarding security alerts and incidents to Logpoint SOAR enables accelerated incident response by automating manual tasks, resulting in lower security costs and increased SOC productivity. Get Logpoint SOAR with one analyst seat for free now, as part of the SIEM license.
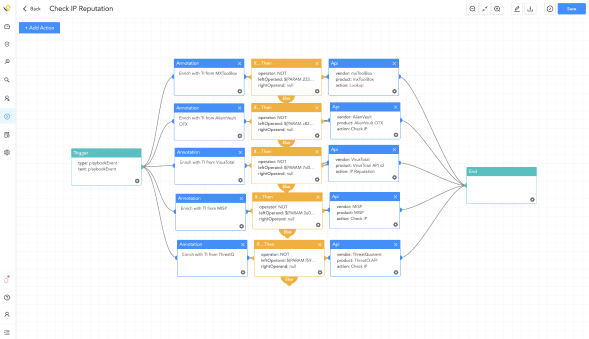
Playbook in Logpoint SOAR
Test the benefits of Logpoint’s SIEM,
UEBA & SOAR solution
To learn more about the benefits of our SIEM, UEBA & SOAR product
and different download options, book a personal demo.
Over 1,000 Organizations Across 70 Countries Use Logpoint SIEM


