by Bhabesh Raj Rai, Security Research
Among developers, ngrok is a popular reverse proxy utility for exposing internal services to the internet by routing traffic through its cloud network. Inspired by a Twitter thread, let’s walk through the process of detecting ngrok’s remote desktop protocol (RDP) tunnel.
ngrok is very easy to use and does not rely on port forwarding, dynamic DNS or VPN. Naturally, what makes it attractive for developers, also makes it attractive for adversaries. Adversaries abuse ngrok for persistence and lateral movement by exposing the local RDP service.
In 2019, Malwarebytes reported threat actors incorporating ngrok in Lord EK. A year later, Trend Micro reported the use of ngrok in an attack against their customer. In the same year, Mandiant disclosed the MAZE ransomware group using ngrok to tunnel RDP connections. Though ngrok can tunnel a wide range of protocols, threat actors have understandably focused more on RDP.

Let’s see the various ways enterprise defenders can hunt for ngrok activity in their environment. Customers can use Logpoint’s Windows v5.4.1 application that includes alerts related to detecting ngrok activity.
Log sources needed
- Windows
- Sysmon
- Snort/Suricata
- Zeek
- Firewall
Detecting ngrok with Logpoint
Creating an RDP tunnel by ngrok leaves a source address value of ::%16777216 in the system’s RDP event logs. Defenders can use this artifact to hunt down reverse RDP tunnels in their environment.
norm_id=WinServer
((event_source IN ["Microsoft-Windows-TerminalServices-LocalSessionManager",
"Microsoft-Windows-TerminalServices-RemoteConnectionManager"])
OR (channel=Security event_id=4779)) (source_address="::%16777216" OR eventxml.address="::%16777216")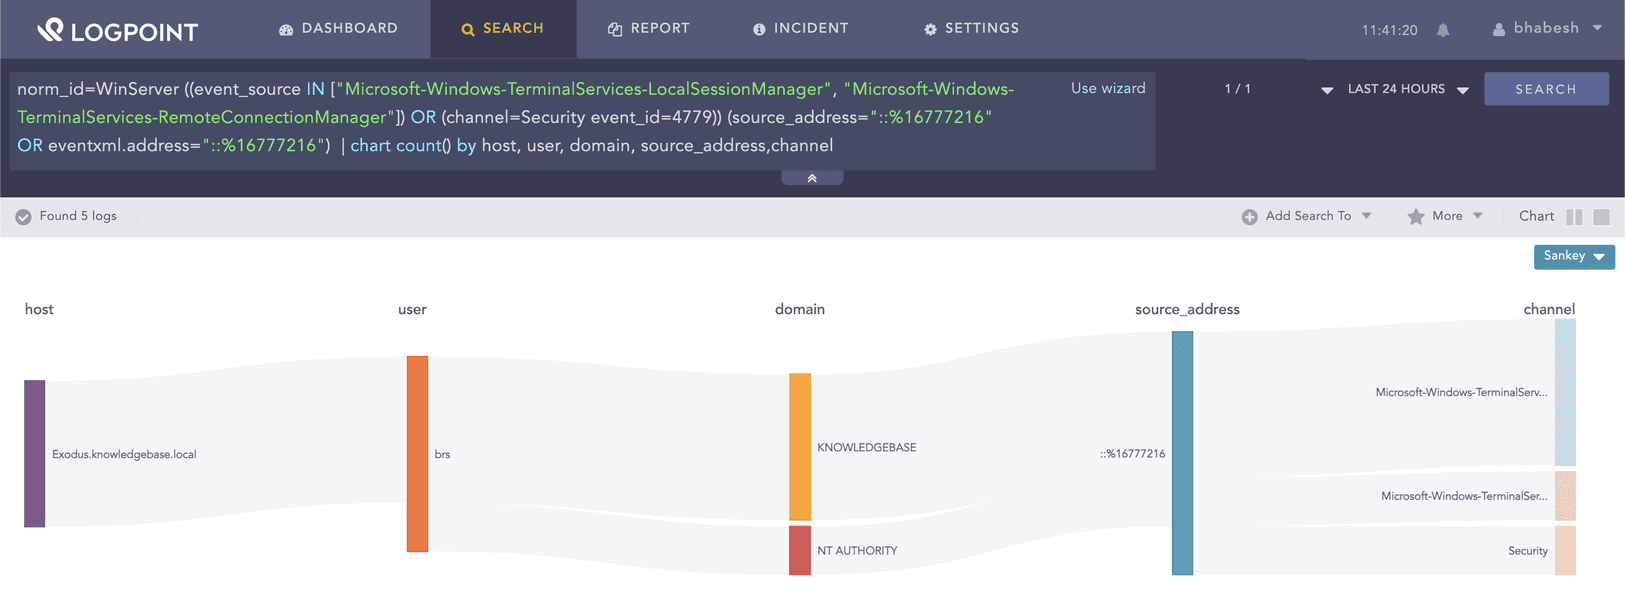
Searching for ngrok’s IP artifact in Windows’s RDP event logs.
Administrators should make sure their Windows systems are forwarding logs from Microsoft-Windows-TerminalServices-LocalSessionManager/Operational and Microsoft-Windows-TerminalServices-RemoteConnectionManager/Operational channels to Logpoint.
Alternatively, analysts can use Florian’s sigma rule that looks at command line parameters used by ngrok.
label="Process" label=Create (("process"="*\ngrok.exe"
command IN ["* tcp *", "* http *", "* authtoken *"])
OR (command="* start *" command="*--all*" command="*.yml*" command="*--config*")
OR (command IN ["* tcp 139*", "* tcp 445*", "* tcp 3389*", "* tcp 5985*", "* tcp 5986*"]))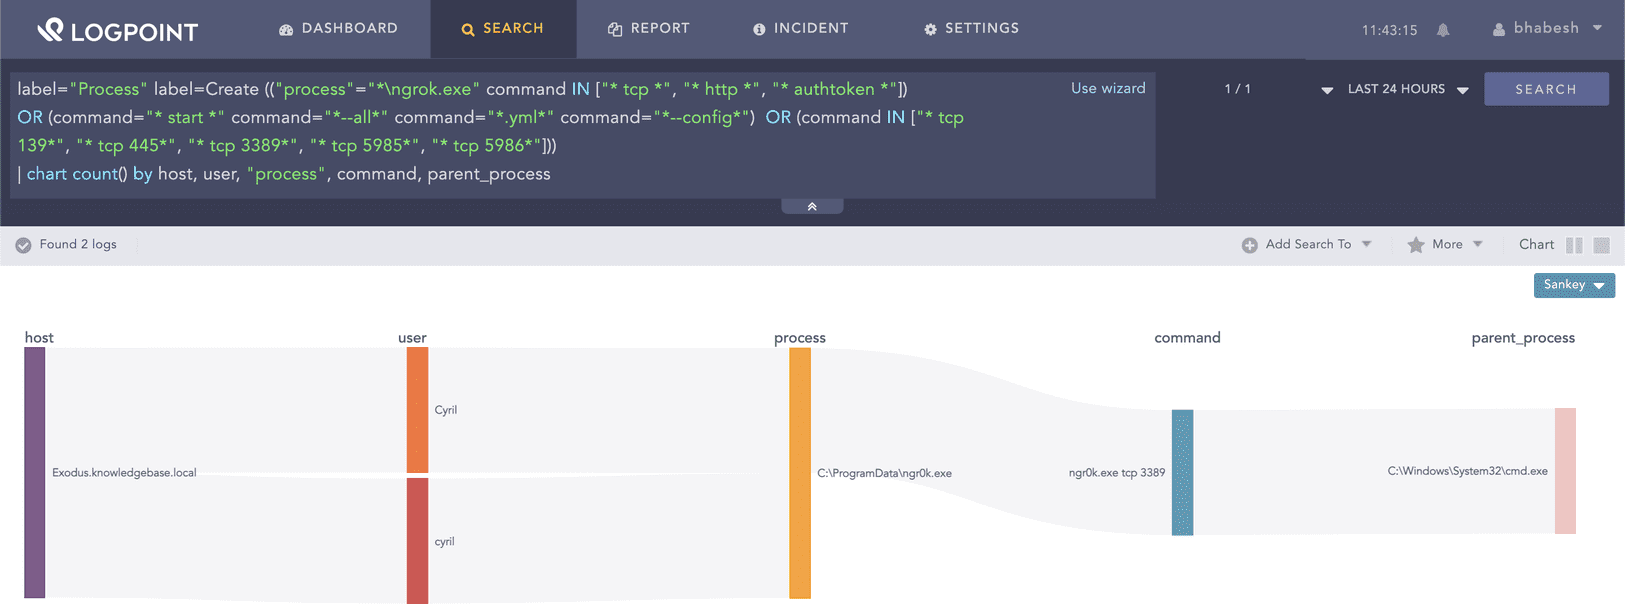
Defenders can use Sysmon to look for unusual processes binding the RDP port with localhost.
norm_id=WindowsSysmon label=Network label=Connection
destination_address IN ["0:0:0:0:0:0:0:1", "127.0.0.1"] destination_port=3389
-"process"="C:\Windows\System32\svchost.exe"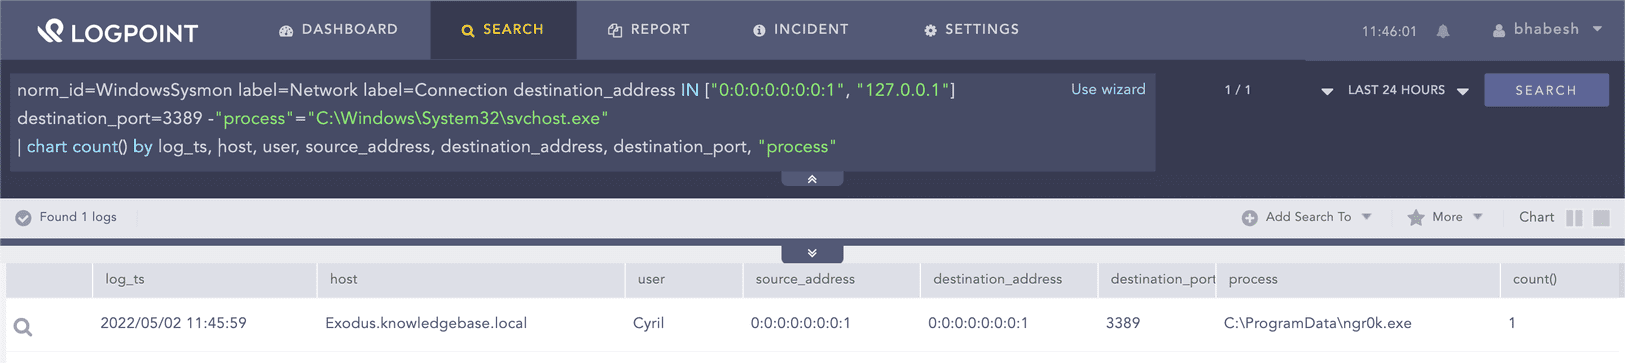
Searching for unusual processes binding the RDP port with localhost.
It is also possible to detect ngrok activity via network logs. The ngrok agent prior to creating the tunnel, will first fetch the ngrok tunneling servers domains and IP addresses list from https://s3.amazonaws.com/dns.ngrok.com/tunnel.json. Analysts can hunt for the ngrok domains in DNS queries.
label=DNS label=Query (domain IN ["tunnel.nrok.com", "tunnel.us.ngrok.com", "tunnel.eu.ngrok.com", "tunnel.ap.ngrok.com", "tunnel.au.ngrok.com", "tunnel.sa.ngrok.com", "tunnel.jp.ngrok.com", "tunnel.in.ngrok.com"]
OR query IN ["tunnel.ngrok.com", "tunnel.us.ngrok.com", "tunnel.eu.ngrok.com", "tunnel.ap.ngrok.com", "tunnel.au.ngrok.com", "tunnel.sa.ngrok.com", "tunnel.jp.ngrok.com", "tunnel.in.ngrok.com"])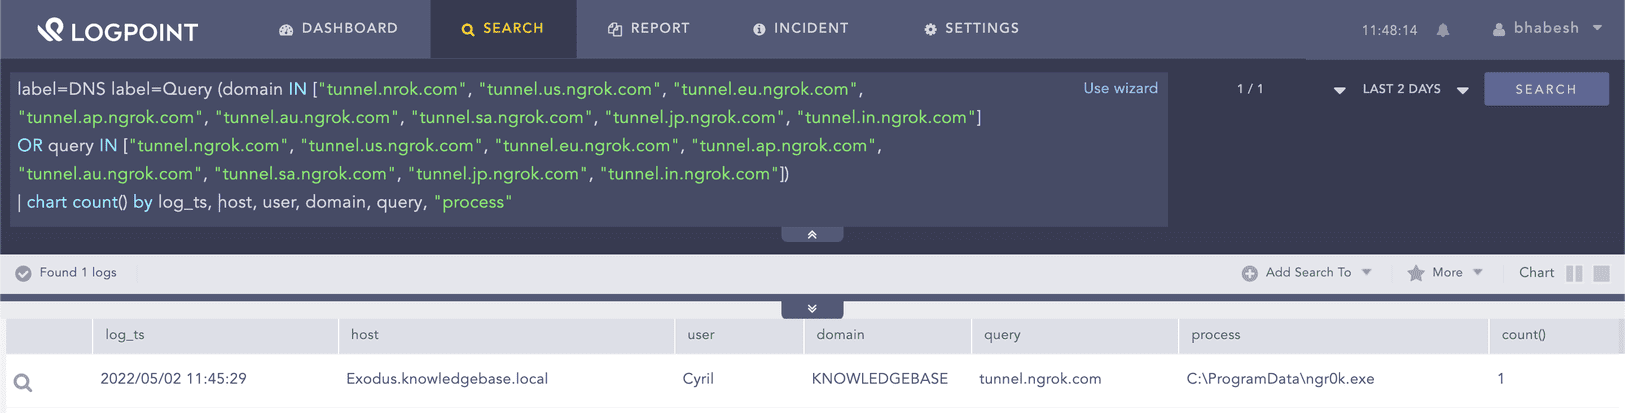
Similarly, analysts can check for the presence of ngrok tunnel IPs in the network logs. We advise administrators to place ngrok IP addresses in a list–NGROK_TUNNEL_IPS–and to regularly update them.
destination_address IN NGROK_TUNNEL_IPSNgrok uses update.equinox.io for updating packages, which defenders can look for in the network events.
domain="equinox.io"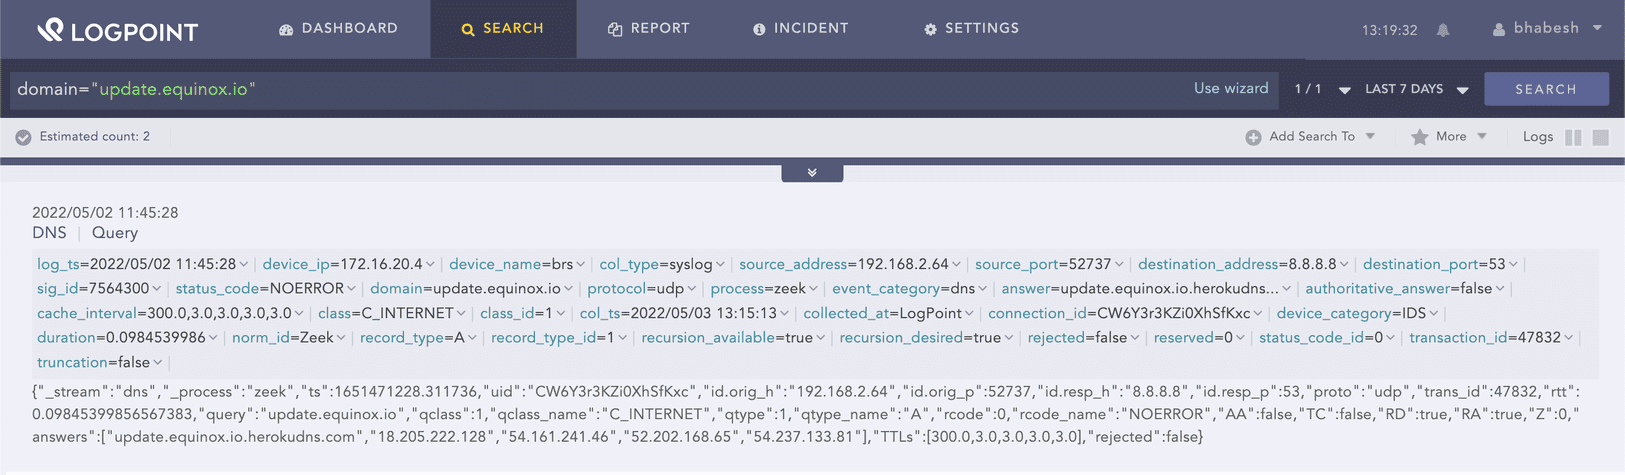
Searching for ngrok’s domain used for update.
Apart from the firewall, analysts can also use IDS/IPS (such as Snort) to detect ngrok activity.
norm_id=Snort message="*ngrok*"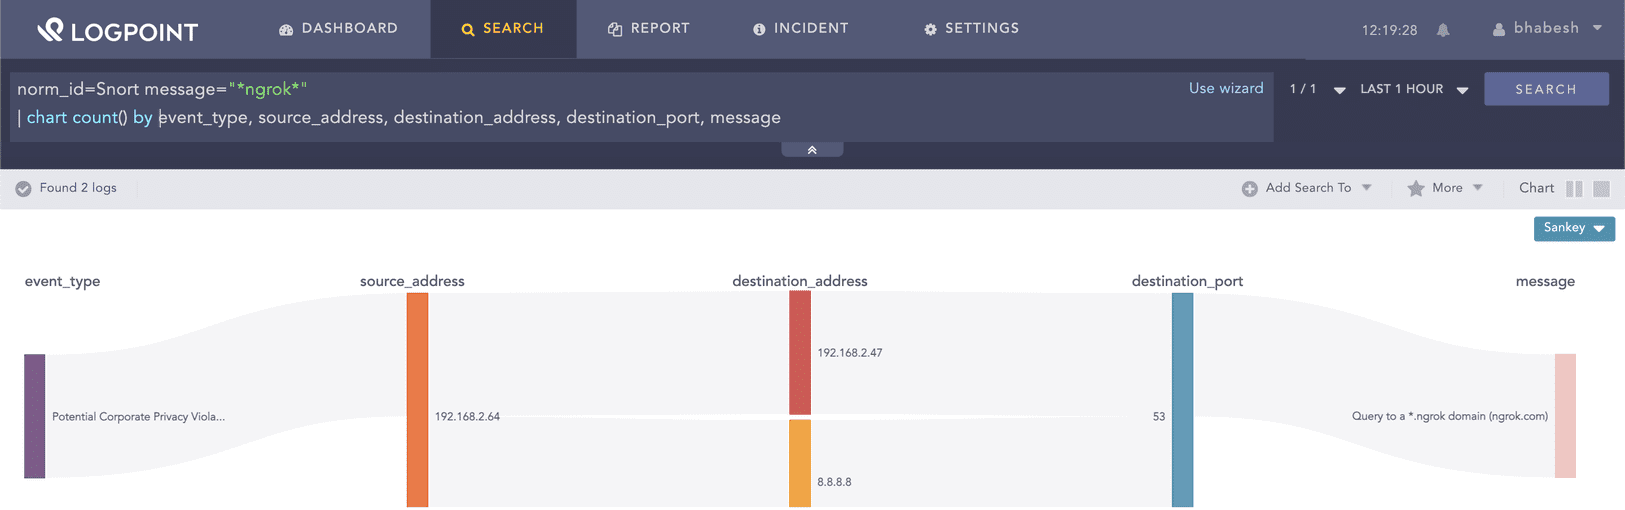
Incident response on true positive
Administrators can take the following steps upon detecting a true positive ngrok alert.
-
Investigate how the threat actor downloaded and executed the ngork binary.
-
Identify the protocol of the ngrok tunnel.
-
Identify the affected user accounts.
-
Investigate which systems the threat actors accessed using the tunnel.
Customers can run their SOAR playbooks to remediate compromised user accounts and clean up affected systems.
Implementing detection-in-depth is key in the current threat landscape
Ngrok is just one of several examples of threat actors using legitimate tools for their nefarious purposes. Adversaries will try their best to blend in with the background noise to make the work of defenders very difficult. Detection-in-depth is essential along with visibility into endpoint, network, identity and cloud logs.
If developers use ngrok, we advise organizations to baseline the legitimate ngrok activity and safelist them so that any unusual ngrok activity stands out from the noise.


